Federgraph 2013
Before reading on please have a look at the Federgraph formula.
A download link and first steps using the program are listed in the Tutorial.
Federgraph is intended to become a community driven project. This page may be a starting point for your participation.
Federgraph uses springs as components in its physical model.
One end of each spring is attached to a coordinate in 3D space.
All springs are connected to each other in point (x, y, 0).
The connection point is moved in the plane z=0.
The force necessary to move the point is computed and plotted.
The force is a vector, which has a length/amount (Betrag) and a direction (Richtung).
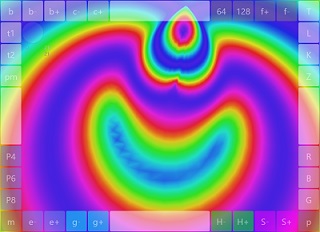
Federgraph will raster over the (x, y) plane and plot Betrag or Richtung as a function z = f(x, y).
Federgraph will also plot the energy (Energie) that is contained in the system.
Start with Betrag, Richtung and Energie.
This will give nice images to look at.
You won’t find the Federgraph formula in the text books.
With the help of the computer you will discover things not seen before.
A great scene to start with uses three springs and arranges them in a equal sided triangle for
ultimate symmetry. The coordinates of the springs are in plane z=0, around the origin.
The Federkennline of the springs will be linear with a notation like F1 = k1 * (t1-l1);
where l1 is the length of spring 1 when F1 is zero and k1 is not.
Length l is a computed value, the actual length of the spring, which changes as you move point (x, y).
Feel free to implement Federgraph in any programming language you like.
In the following sections I will specify some details that should be the same across all implementations of Federgraph. The specification is a draft. It will change until it has finalized. Your comments are welcome.
Using the mouse
Drag with left mouse button down to rotate the 3D figure around the horizontal and vertical axis. Drag with right mouse button down to rotate around the z axis. Use Ctrl scroll wheel to zoom in or out (move camera z position).
Use the scroll wheel of the mouse to adjust the value of the selected parameter of the model, by default in large steps of 10 or -10. Use shift scroll wheel to change the selected parameter in small steps (1 or -1).
You see, I have given top priority (scroll wheel without Ctrl or Shift) to changing the current model parameter, because this is what the application is all about.
Using the touch screen
On all 4 sides, the empty area between the square buttons is sensible to touch similar to a trackbar/scrollbar.
- The top track bar will rotate around z axis.
- The bottom track bar will zoom in and out.
- The left track bar will increment/decrement the parameter value by 1.
- The right track bar will increment/decrement the parameter value by 10.
Note that zoom and rotation around z axis are not implemented by the usual gestures as you may expect. Instead, the center area of the application window is reserved to control the important rotations of the 3D model around x and y axis. (Use one finger very similar to a mouse move on the desktop.)
Pan has not been implemented in the touch screen version yet, because it would be too easy to rotate the model out of sight, once you have panned it out of the center. (On the desktop, Ctrl left button mouse move can be used for panning.)
Note that the desktop application uses the scroll wheel of the mouse as the preferred control to change parameters of the model. On the touch screen device, the vertical track bars take over that task. Move the invisible thumb of the track bar/scrollbar slowly while you watch the text labels that show the current and actual parameter value.
Changing parameter values is a costly operation that is timed. This means that the frequency of it happening is limited. If you scroll faster on the track bar, then it does not update the model more often.
Also pay attention to the amount of detail in the image (32, 64, 128, 512, 1024). The number of vertices computed in the image will be square (of that number). Use a lower resolution like 64 while you are adjusting the parameters. Only when you want to look at the ‘final’ image would you want to increase the number of vertices to a higher value. This may vary depending on the computing power of your device. High resolution images slow things down, you will quickly notice that. Some skill on your part is required to bring out the full potential of the application. This is part of the ‘game’.
The mouse wheel would give you tactile feedback, so you can conveniently increment the value in small and large increments using the mouse. Given that it is not quite so convenient with the virtual track bar on the touch screen device, remember to move your finger slowly and keep watching for the value in the text label while you scroll. Of course, most of the time it is enough to watch the image as it changes.
Using the horizontal track bars for rotation about z and zoom is intuitive, because the operation is fast and it is not timed. Try it out once and you know it. Only the vertical track bars need special attention. The skill you develop using them is key to using the App on the touch screen device.
Learning how to use the application is perhaps easier on the desktop, but using it is as much fun on the touch device. The touch experience may be further improved in the future as I learn how to do it best.
Smiling is hard, but I keep trying.
Using the keyboard
I have already run out of keys, but found the mapping below useful. I recommend to reserve the following keys for the important features. Use keys that I have left blank for your own set of features. (I will not hit those when I get a chance to test your implementation.)
a start and stop animation
A
b toggle between small and big state of texture mapping
B select parameter Limit (Begrenzung)
c cycle color scheme forward
C cycle color scheme backwards
d toggle visibility of drop target for custom texture image file
D
e cycle through available plots forward
E cycle through available plots backwards
f cycle through flags
F
g
G
h cycle through help entries forward
H cycle through help entries backwards
i
I
j
J
k cycle through parameters kn
K select parameter K which keeps all k at the same value when changed
l cycle through parameters ln
L select parameter L which keeps all l at the same value when changed
m toggle MCap (negative cut off)
M
n
N
o cycle through parameters ox, oy, oz (offset values)
O
p toggle PCap (positive cut off)
P
q
Q
r cycle through parameters rx, ry, rz (rotation angles)
R select parameter R (range)
s toggle solution mode
S
t cycle through parameters t1, t2 (texture offset and width)
T select parameter T which changes (xn, yn) to form a regular shape depending on Dim
u
U
v
V
w
W
x cycle through parameters xn
X
y cycle through parameters yn
Y
z cycle through parameters zn
Z
( set mesh size to 128
) set mesh size to 256
{ set mesh size to 32
} set mesh size to 64
[ set mesh size to 512
] set mesh size to 1024
!
/
?
#
*
+
-
~
;
:
1 select plot 1
2 select plot 2
3 select plot 3
4 select plot 4
5 select plot 5
6 select plot 6
7 select plot 7
8 select plot 8
9 select plot 9
0 select plot 0
Shift 1 select figure 1
Shift 2 select figure 2
Shift 3 select figure 3
Shift 4 select figure 4
Shift 5 select figure 5
Shift 6 select figure 6
Ctrl 1 select graph 1
Ctrl 2 select graph 2
Ctrl 3 select graph 3
Ctrl 4 select graph 4
Ctrl 5 select graph 5
F1 select scene 1 (one spring only)
F2 select scene 2 (two springs evaluated)
F3 select scene 3 (three springs)
F4 select scene 4 (four springs)
F5 select scene 5 (five springs)

Enter toggle state of selected flag
Del clear out external texture bitmap and use default again

Ctrl c copy current data to the clipboard
Ctrl v paste current data from the clipboard
Find a snapshot of the currently implemented actions in this table.
The data format
An example for the data format is given below. Several formats have been implemented. Look at the ‘reference application’ to see the data as it is output to the multiline edit control or put into the clipboard. It should be plain text. It should be possible to return the data from a web server, store it in files or hide it in a field of a database. The Text should be encoded as UTF-8 but will look like Ascii/Ansi. All values on the right side of the key=value pairs are numbers. Write out the floating point values locale independent with a point as decimal separator. Applications should be able to parse the java properties style or the Pascal style.
The Pascal style is useful when you want to copy and paste a sample from the TMemo to the source code editor of the Delphi IDE to improve a built in sample.
procedure TSampleHub01.InitSample1;
begin
  with fd do //fd is of type TFederData
  begin
    x1 := -20.00;
    x2 := 20.00;
    x3 := 0;
    x4 := 0;
    y1 := -20;
    y2 := -20;
    y3 := 20;
    y4 := 0;
    l1 := 0;
    l2 := 0;
    l3 := 0;
    l4 := 50;
    k1 := 10;
    k2 := 10;
    k3 := 10;
    k4 := 0;
    OffsetX := 0;
    OffsetY := 0;
    OffsetZ := 0;
    MinusCap := False;
    PlusCap := False;
    Opacity := False;
    Bigmap := False;
    MeshSize := 64;
    Gain := 0;
    Limit := 0;
    Range := 0;
    Scene := 3;
    Graph := 2;
    Plot := 5;
    Figure := 3;
    Param := 23;
    Bitmap := 1;
    Color := 1;
    AngleX := -152.77;
    AngleY := -32.23;
    AngleZ := -103.30;
    PosZ := 21.03;
    T1 := 115;
    T2 := 25;
  end;
end;
Default values can be dropped to compact the text.
The communication protocol
You can send ‘strings’ over tcp. Pseudo code follows:
var
  s: string;

s := 'A.B.Z1.Y4.X4=-2';
Send(s);

procedure Send(s: string);
var
  s: string;
begin
  s := '#2' + s + '#3';
  //s := '#2' + header + '#4' + s + '#3'; //depending on what you do
  //now put s as Bytes on the wire
  //(and parse them on the other side)
  //there is a server application available where senders and receivers can connect
end;
To the left of the equal sign there is the ‘Key’. The definition of the key will be available in source form. To the right of the equal sign is the ‘Value’, an Integer value. Floating point values and Boolean values will be mapped to an Integer. A float (single or double) will have 2 digits after the decimal point (scaled by 100).
Navigation among built in samples
Navigate to the built in samples with the arrow keys. On a touch screen, tap on H+, H+, S+ or S- buttons.
The application should have a small number of built in samples. The user should think of a matrix of samples. Samples are organized in rows (hubs) and columns (samples). Hubs can have a different number of samples, but no more than a maximum specified. If a hub does not have enough samples it should ‘inherit’ the missing samples from the default hub, which must have a full set of samples. Such the user will be able to navigate the matrix of samples. Next, Previous, Up and Down will wrap around, so the arrow keys will always give a new sample.
(It should be easy to replace the built in default sample data by external data that you load from somewhere at runtime.)
Animations
View rotations around the screen x or y axis will get a reserved key binding. Starting/stopping of a transition between the current sample and another (the next) will get a standard key binding, and be available if implemented. (The next sample may be sent to the program from a remote client.)
Copyright
copyright © 2013 federgraph.de