| SE | FA | FM |
Minimal Snippet
The image you see is the shape of the built-in model, not the minimal snippet.
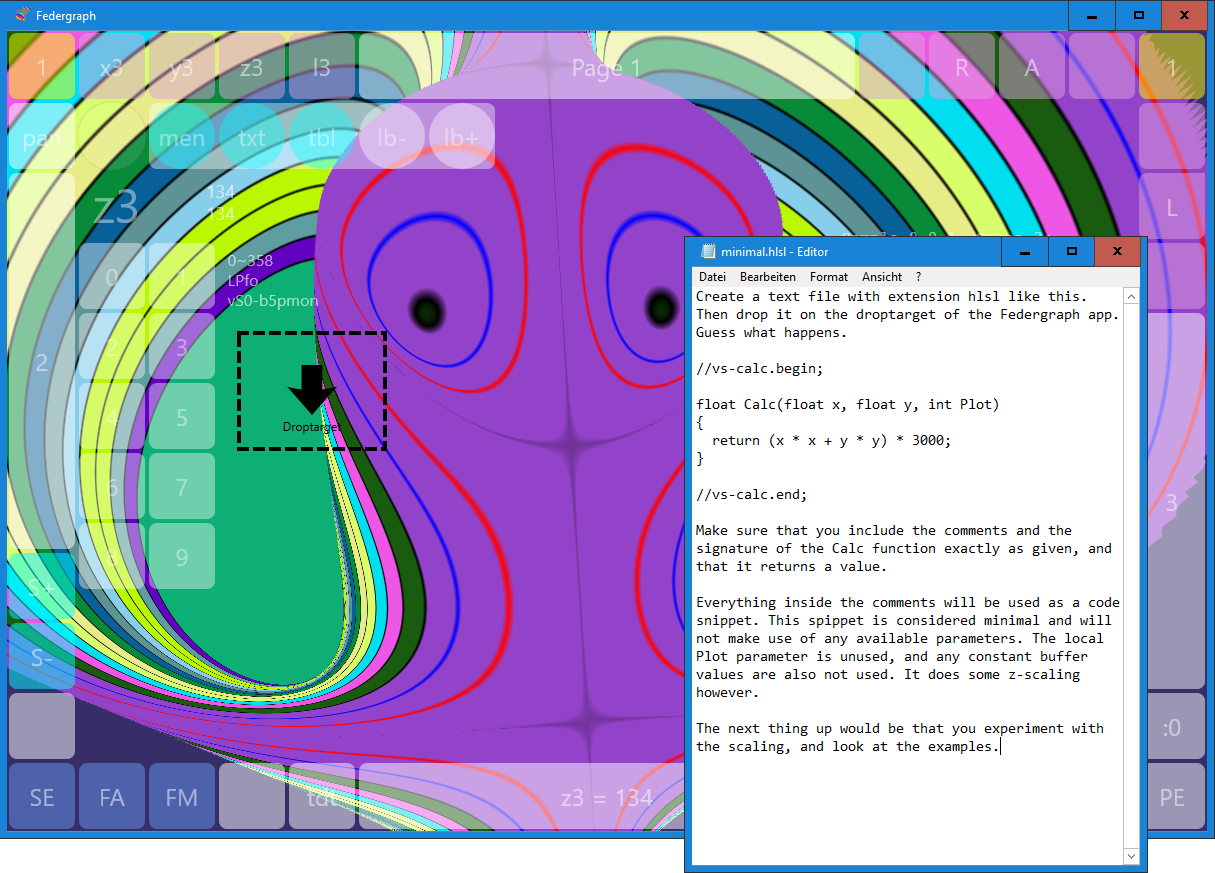
Guess what the shape will look like if you drop the minimal snippet.
I will provide example files for download from GitHub, including some snippets, which can be dropped on the drop target.
Getting started: how to Play
First find out how to manipulate view params:
- how to rotate
- how to scale
- how to translate
- how to reset
( Then find out how to manipulate model params. )
How to manipulate view params
Rotateby dragging the mouse, with left button down or with right button down.Scalewith Ctrl-Wheel.Translateby dragging with Ctrl - left mouse button down.- Reset rotation with Escape key.
- Reset both rotation and translation with Shift-Escape.
The above steps use keyboard and mouse and work no matter what the currently selected parameter is.
How to Pan using touch
When depending on touch input only you need to select param pan.
You can pan in x and y direction by using the left or right touch bar or by using wheel / Shift-wheel.
Remember to select another - perhaps the previously selected - parameter when finished with panning.
About the Tool button
You can hide and show the button frame with the Tool button.
Buttons are arranged in a Grid layout.
- The top left button is at button raster position (0, 0).
- There is a circular button with no caption at position (1, 1). This is the Tool button!
When the button frame is hidden, the Tool button is still there. But it is almost transparent, you can hardly see it.
Find and click the Tool button to toggle the button frame back on.
Custom background image
There is a fun thing: you may want to try out changing the background image.
Make the viewport transparent and load a background image behind it. How to do that should be subject to a blog post or video - to be done.
But here are the steps:
- Read ‘Help for input’ in ‘Feder Memo’ in FM.
- Show (toggle) the drop-target by activating button
tdt. - Show the checker board by activating button
c+(color plus) until there. - Drop a jpg or png image file.
- Rotate, scale and translate the mesh (foreground image).
- Hide the drop-target.
- Hide the button-frame.
- Make screenshot.
You can drop different things onto the drop-target: model data, texture images for the mesh, or a background image.
For the dropped image to be taken as a background image you need to select the transparent background mode before you drop.
When in transparent background mode (color mode is selected):
- If NO background image is present you see a checker board.
- If a background image IS present you see the background image.
The transparent background mode is used as a condition for the application to decide what to do with the dropped image. (I needed to tell you, and I have.)
Note:
- If you drop the image file while the checker board is NOT visible you can recover like so:
Press del key on keyboard followed by click on buttons
#, b, b, b. - If you no longer want to see the background image, use keyboard key c or button
c+. This will select another background mode.
Now that you know how to show a foreground image (the rendered mesh) in front of a custom background image (the dropped image) you are almost ready to create artwork (internet memes).
In the screenshot above there is no custom background image.
What you see is the rendered mesh in front of a deep blue solid color background.
You can see the blue background near the bottom left corner of the window.
There are several background colors to select from, they come as part of the selected color scheme.
The c+ and c- button will cycle through the available schemes.
There is another color scheme: for texture bitmaps and related buttons
b+andb-.
So much for the background color or image.
Built in samples
Click on buttons S- and S+ to cycle through built-in samples.
I am using the app on the desktop and use keyboard keys.
Explore
To work with the built-in model is also not difficult.
You select a parameter, change its value, and watch the image.
It is key to know what parameters are available and how they are used to modify the mesh / shape or view.
There are model parameters and view parameters.
Think about a real use case
Using your own model may be a little more involved, but if you first study the built-in model it will be greatly simplified.
I don’t think you have a use case other than playing, but if you do: don’t hesitate to notify me.
A version 1.0 release note
The first internal version of the program was created in 2011 using Delphi XE2 (FMX).
Make sure you test the application out on your normal desktop computer which has a keyboard and a mouse. The mouse wheel works great on Windows. There is nothing better than a real mouse wheel on Windows. The app has been designed for it. It always worked well.
On a Surface Pro with m3 processor the app is fast and fun to use. Touch screen in tablet mode is great. But the touchpad of the attached keyboard is no real replacement for the original mouse wheel. Keep that in mind. To make a judgement on how to control the app you should use it as intended by the developer, on the real desktop.
This application can be compiled cross-platform for the Mac, currently 32bit only.
A note about the Mac version: The mouse wheel of a normal mouse attached to a Mac Mini does not work the same as on Windows. This may be a little bit of a problem. I also tested the latest magic mouse attached to iMac. I think this is better, but still different. It behaves more like the touchpad. It shows an animated behavior but what you do not seem to get on a Mac is the rasterized, snappy behavior a I just take for granted on Windows. Please try the app on a Windows machine so that you know what I am talking about.
Use the desktop for real work. The program has always been a Windows program. It has been developed on Windows and tested there for much longer. However, for showing off finished samples the touch screen devices or a Mac are perfect.
Talking about using the app and the importance of the mouse wheel, I also wanted to briefly say something about the size of the main app window. You should not run it full screen. You can, but then it must render a lot more pixels or fragments. Don’t resize the window too often, or minimize and restore it too often. Just leave it in background with the same size. The reason is that the render target buffer must be recreated when you resize. Try it out, but then apply some sanity when using the app. Make it full screen when you want to render the final image with as many pixels as possible. Then go back to the normal size for normal work.
The text in front of the mesh takes time to render. You will recognize that when you switch it off. It will be noticeable on a machine which is not the fastest of all.
Always valid
Once everything about the app has been explained you cannot discover it anymore. The most important aspect of the application is that it enables you to experiment. Whether you experiment with the model or the application itself, you need to experiment.
If only the fun part of the thing catches on, Federgraph will be ok.
But what is it
Think about a vector field or a scalar field in 3D space. The length of the vector is a scalar. The directional cosine of the vector direction is also a scalar. For every location in space you can show that scalar value in the plot.
You have seen cubes with lots of little arrows inside to show the spatial distribution of the length and direction of a vector, but this is not what I wanted for this application.
Federgraph takes a different approach by slicing the field - nothing new, often used. Take a plane and cut through space with the plane. Any plane will do. Now you can show floating-point values over that plane, in the same way you normally plot values over a line.
I like to relate to cone sections. You have a cone in 3D space and cut through it with a plane and get interesting figures everyone knows about.
I worked with system of linear springs, the mechanical elements called Feder in German language. These are difficult or impossible to realize in a physical setup. it makes sense to simulate them.
You could as well examine nonlinear springs, magnetic forces between bodies, or electrically charged discrete items.
Imagine that you use equipment to move a sensor through a field. The machinery will likely move the sensor within a plane, along a line or a circle, or along a specific path. This will give nice plots, but simulating values over an area instead of a line is much better.
Model transform: I mentioned that you can use any plane to slice the volume. No matter what plane gets chosen, you can always rotate the whole model/system so that the sensor plane is in plane z = 0. This is important. I make use of this trick in the application.
Intersections : The app will allow you to intersect the mesh with a vertical plane, so that you see values plotted over a line. Alternatively you can use a vertical cylinder, so that you see values plotted over a circle. You can move the plane and/or the cylinder around and examine the intersection.
More:
- Looking at the data plotted over an area you see more. This is sometimes revealing.
- Then there is color. Color can make a difference.
- Then there is antialiasing. Very important.
- Then there is the improved speed when you evaluate the formula on the GPU. This makes a huge difference when you want detail.
- Then there is the possibility to change the formula at runtime. You will use the shading language like a scripting language. Very important.
Plot: When you experiment with the model (formula) you are NOT computing solutions for a set of equations, you will just plot the values to get a wider picture of how the system behaves when you change a parameter.
Real Time: You change a parameter and see the image change in real time. You cannot see everything at once, but you see more if you plot over a plane instead of plotting over a line.
Motivation: What is needed is a mix of
- execution speed,
- detail (number of vertices in the mesh),
- a convenient way to select a parameter,
- and a convenient way to change the value of the selected parameter.
The keyboard seems to be the best way to SELECT a parameter.
The mouse wheel seems to be the best way to CHANGE a parameter.
Benefits: You can have the
- ability to compile a custom application,
- and the ability to distribute it royalty free.
Imagine you have figured out what formula is worth plotting and how many parameters you need.
This is still a draft, page updated in May 2019 ; copyright © federgraph.de